What is Core Dump and How to Analyse Core Dump Using GDB?
We compiled and run the C program but sometimes we get the segmentation fault and the core file generated this moment. Segmentation fault happens because of some memory violation in the code. later you can use the core file and debug the code using the GDB.
What is Core Dump?
A core dump is a file that stores a snapshot of the program memory at the program crash.
- A core dump file is generated when the program terminates by the SIGSEG signal because of tried to access the invalid memory address.
- A program terminates or crashes due to various OS signals like SIGSEG, SIGKILL, SIGABORT, etc.
- Core dump file is used by the GDB to analyze why the program crashed.
This example code gives the segmentation fault error and generates the core dump file.
//This program segmentation fault
#include<stdio.h>
#include<stdlib.h>

int main(void)
{

    char *ptr;
    *ptr = 'x';

    return 0;
}
#Now Compile the above program with -g flag
$gcc core_dump.c -o  core_dump -g

#Run the program with the below command
$./core_dump

As you see core file is not generated so you need to do the below step.
Step-1: Set core file size limit
Linux provides a utility called ulimit to set core file size and other parameters.
This command shows the core file size limit .
$ ulimit -a
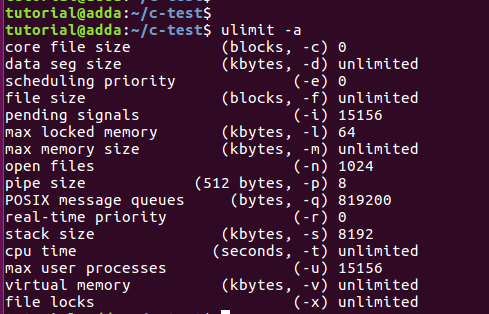
#As you are seeing the core file size is set to 0 so we need to set it to unlimited with the below command.
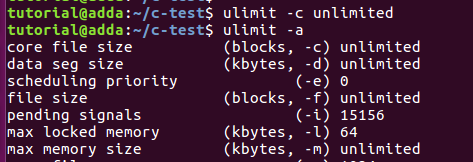
$ ulimit -c unlimited
Now you can see the core file size is unlimited.
Step-2: Core dump analysis
Now we will generate the core dump file and analyze the segmentation fault using the GDB.
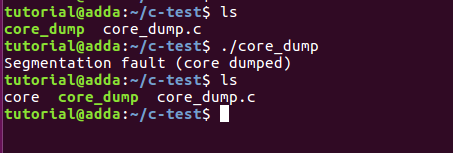
# Again run the program and this time core file will generate .
$ ./core_dump
Segmentation fault (core dumped)
Start GDB with program and core file with below command.
# Load program binary and core file
$ gdb core_dump core
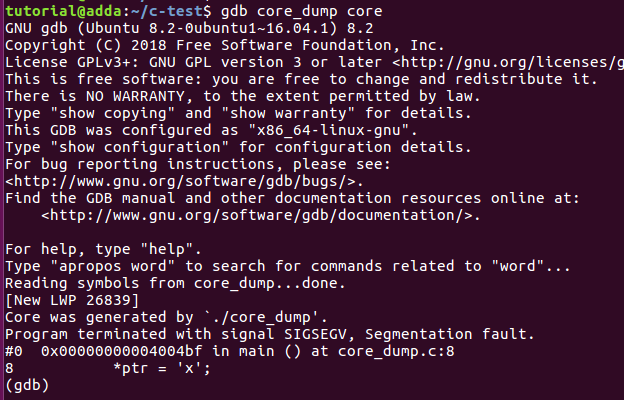
Here gdb directly pointing the line number which causing the segmentation fault.
Run a few gdb commands to get more info.
# List command shows the program source
(gdb) list
# print to print the variable`s value
(gdb) print ptr
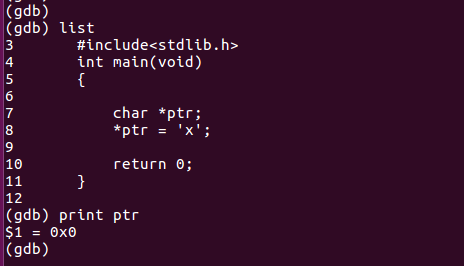
As you see this line "*ptr = 'x'" causing the problem because ptr is a null pointer as we checked the ptr value and it is "0x0". it is not any valid location so that we are getting the segmentation fault.