What is Valgrind?
Valgrind is a debugging tool used for memory debugging, memory leak detection, and profiling tools.It is a wrapper of various debugging tools and memcheck is the most popular tool of the Valgrind.
Valgrind tool is used to detect the common memory-related issue of C and C++ programs and it helps to optimize memory uses during running the program.
How to install Valgrind on Linux
On Ubuntu, you can install Valgrind using the below command.
$ sudo apt-get install valgrind

# check Valgrind version
$ valgrind --version
What type of memory issue it can detect.
Valgrind can detect many memory-related issues that are common in C and C++ programs. some of the following.
- Dynamic memory allocation (uses vs free mismatch)
- Double free
- Out-of-bounds memory access(read/write underflow/overflow bugs)
- Use of uninitialized memory
- Uses of the memory after it has been freed
How to debug program using Valgrind
Valgrind is a wrapper of the various tools so we use memchek to debug our program.
follow the below steps to debug the program
- Compile Program with debugging symbol.
We need to add debug symbol in program binary so compile the program with the -g flag.
#compile with -g flag
$gcc -o test test.c -g
- Run Valgrind command
Suppose you have generated the test binary then run the below command and it will generate the report of memory error and leaks.
# valgrind command
$ valgrind --tool=memcheck --leak-check=yes  ./test
Example
Let's see how we can use Valgrind to debug the memory-related issue. I am creating a simple program and allocating some memory using the malloc.
#include<stdio.h>
int main(){
  char *ptr;

 /* allocating 10 byte using malloc */
  ptr = (char *)malloc(10);

  /* again allocating 10 byte using malloc */
  ptr = (char *) malloc(15);
  free(ptr);
  return 0;
}
Compile the program with the -g debug option
gcc -o test test.c -g
we got the test binary with debug symbol. now run the Valgrind command
valgrind --tool=memcheck --leak-check=yes ./test
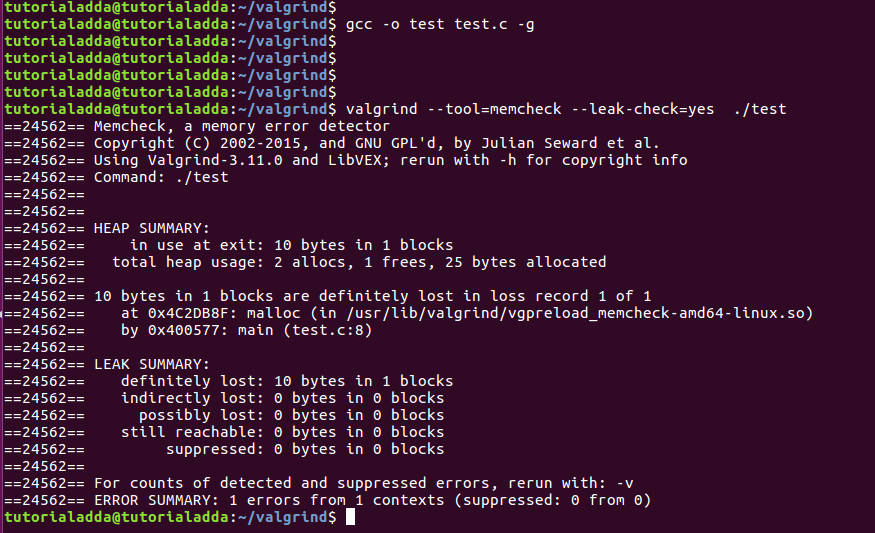
This will provide the following info.
==24562== Memcheck, a memory error detector
==24562== Copyright (C) 2002-2015, and GNU GPL'd, by Julian Seward et al.
==24562== Using Valgrind-3.11.0 and LibVEX; rerun with -h for copyright info
==24562== Command: ./test
==24562==
==24562==
==24562== HEAP SUMMARY:
==24562==     in use at exit: 10 bytes in 1 blocks
==24562==   total heap usage: 2 allocs, 1 frees, 25 bytes allocated
==24562==
==24562== 10 bytes in 1 blocks are definitely lost in loss record 1 of 1
==24562==    at 0x4C2DB8F: malloc (in /usr/lib/valgrind/vgpreload_memcheck-amd64-linux.so)
==24562==    by 0x400577: main (test.c:8)
==24562==
==24562== LEAK SUMMARY:
==24562==    definitely lost: 10 bytes in 1 blocks
==24562==    indirectly lost: 0 bytes in 0 blocks
==24562==      possibly lost: 0 bytes in 0 blocks
==24562==    still reachable: 0 bytes in 0 blocks
==24562==         suppressed: 0 bytes in 0 blocks
==24562==
==24562== For counts of detected and suppressed errors, rerun with: -v
==24562== ERROR SUMMARY: 1 errors from 1 contexts (suppressed: 0 from 0)

valgrind memcheck tool giving info of heap summary that we allocated a total of 25 bytes.
In total 25 bytes, we definitely lost 10 bytes and provided which malloc call responsible for this leak.
This leaks due to malloc call preset at line number 8 in the test.c program.As you can see we allocated but not freed.
Now I will free the memory after allocation and debug again.
#include<stdio.h>
int main(){
  char *ptr;

 /* allocating 10 byte using malloc */
  ptr = (char *)malloc(10);
  free(ptr);
  /* again allocating 10 byte using malloc */
  ptr = (char *) malloc(15);
  free(ptr);
  return 0;
}
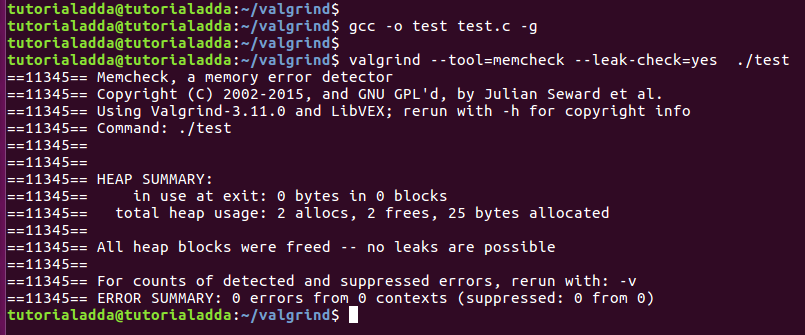
Valgrind provides the following result
==25213== Memcheck, a memory error detector
==25213== Copyright (C) 2002-2015, and GNU GPL'd, by Julian Seward et al.
==25213== Using Valgrind-3.11.0 and LibVEX; rerun with -h for copyright info
==25213== Command: ./test
==25213==
==25213==
==25213== HEAP SUMMARY:
==25213==     in use at exit: 0 bytes in 0 blocks
==25213==   total heap usage: 2 allocs, 2 frees, 25 bytes allocated
==25213==
==25213== All heap blocks were freed -- no leaks are possible
==25213==
==25213== For counts of detected and suppressed errors, rerun with: -v
==25213== ERROR SUMMARY: 0 errors from 0 contexts (suppressed: 0 from 0)

As you see there is no memory leak after freeing the allocated memory.